Credits: “Physics of Filtered Coffee” by Jonathan Gagne
1.1 Introduction: Coffee Brewing Control Chart
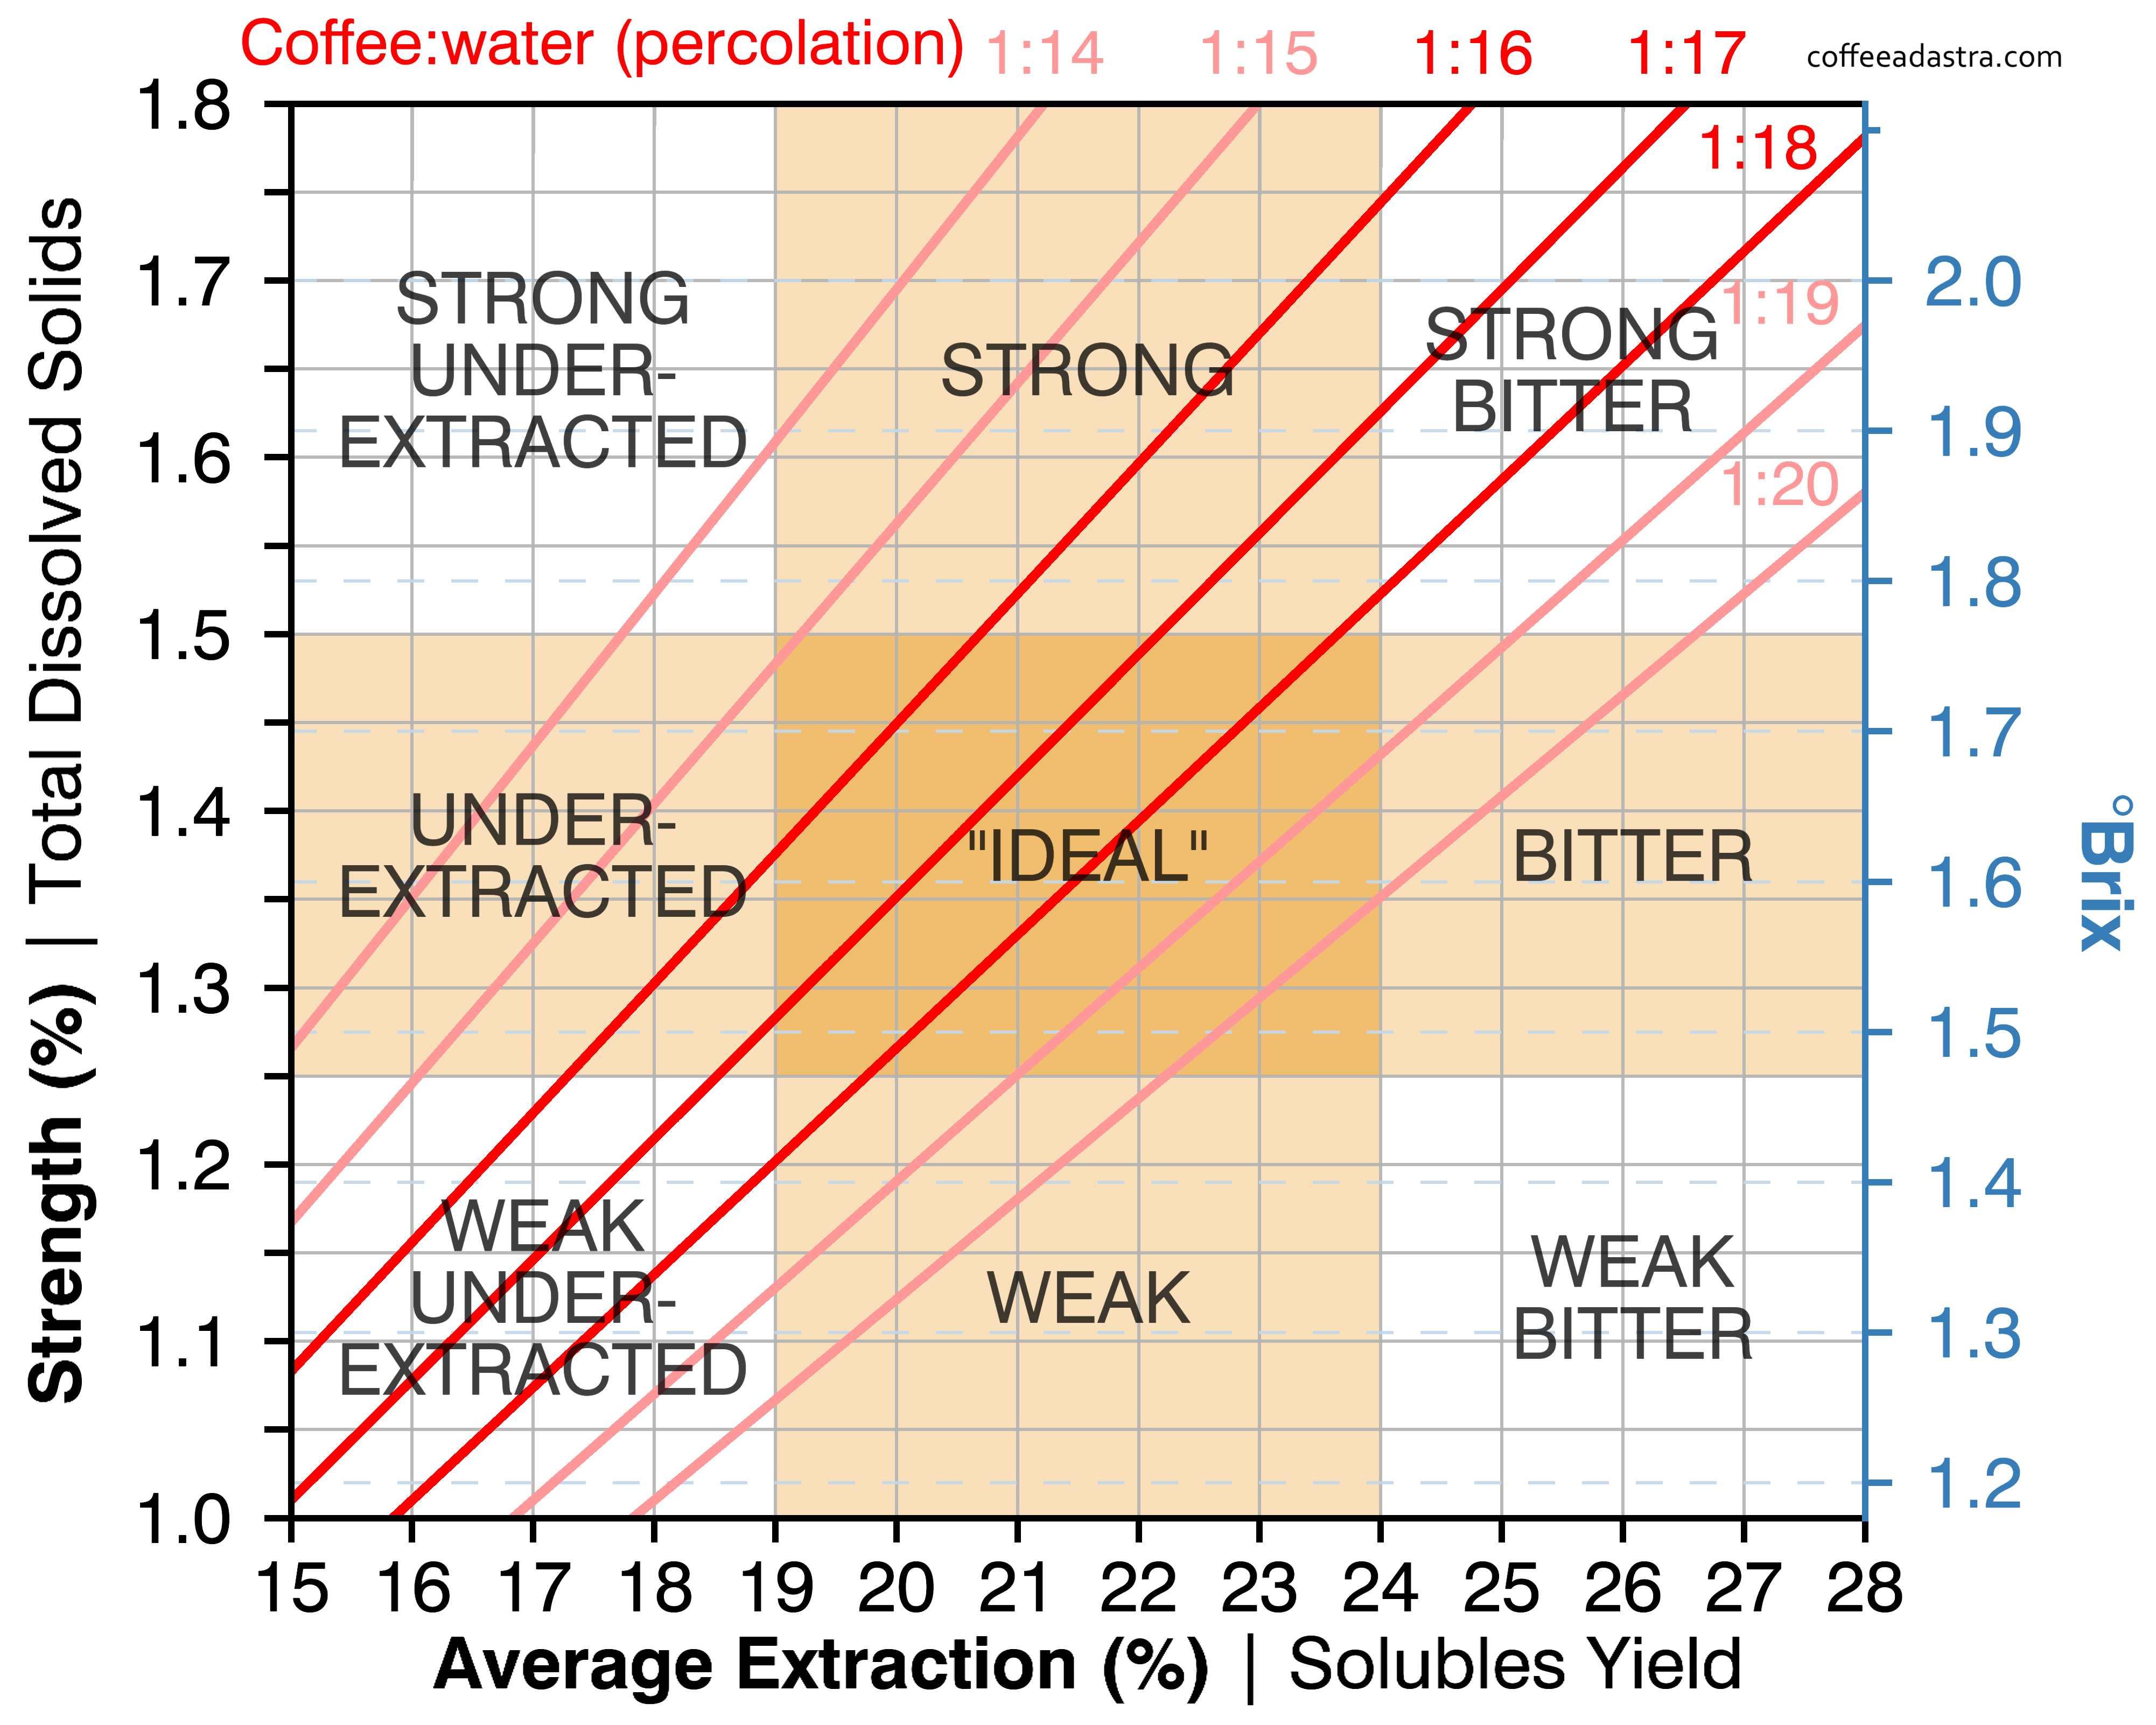
For this blog, I am not going to repeat what most books have discussed about the Coffee Brewing Control Chart, and curious readers can google or read any Professional Coffee Books for how to use and understand coffee brewing concepts, like Brew Ratio, Coffee Strength/concentration (TDS (%) = Total dissolved solids), and average extraction yield (%). As one can intuitively see in the above graph/diagram, the Coffee Brewing Control Chart plots a linear relationship of a typical Brew Ratio of one’s choice of coffee, and how you can change brew parameters/factors one at a time to shift your points upwards or downwards along the straight line (of your chosen Brew Ratio) to get to the desired coffee taste outcome you want to achieve.
If you are one who is so obsessed about getting specific outcomes like a coffee scientist, I do recommend investing in a Coffee Refractometer, which a barista can measure their brewed coffee strength TDS, and you can quantitatively be able to apply this chart to locate where your brew points lie. If not, one can apply this Coffee Brewing Control Chart qualitatively, and use Taste as an objective marker to describe your taste of coffee. Remember even the above Coffee Brewing Control Chart is far from being perfect, and it has inherent limitations.
For example, the preferred range of coffee strength is subjective, and the Coffee Brewing Control Chart is based on experimental data of a finite sample size of coffee consumer’s taste preference in USA MIT University (Coffee Brewing Institute) in the 1950s. Now in 2022, we are moving into the 3rd wave of coffee, and possibly 4th wave of coffee, and the Coffee roasting preference styles have since evolved from dark roast (2nd wave of coffee), to preference of lighter roast in the average consumers, and consumer’s coffee strength preference ranges (may not be from 1.2% to 1.5% now) has changed since then, depending on the coffee choices, degree of roasting of coffee, high-grown or low-grown coffees, processing methods of green coffee etc.
Another example of limitations of Coffee Brewing Control Chart as a tool for baristas, it cannot detect poor barista skills of coffee brewing (very uneven extraction of filter coffee with lots of channeling effects) if you just blindly use a Coffee refractometer (TDS meter) to guide you. You can still objectively get an extraction yield into the ideal range (18% to 22%), but your coffee may still taste over-extracted or under-extracted. Why? This is because the extraction yield gives an “average” extraction yield, and you can have a cup which have coffee regions of high channeling effects in which water rush through small regions of coffee bed particles (regions of highly extracted coffee cells), and in other parts of the coffee bed, the flow of water is super slow (regions of over-extracted coffee cells) or even have dry regions in coffee bed (regions of unextracted coffee cells)That is why in pour-over coffee, blooming is very important (besides releasing CO2 gases from the roasting process trapped in the coffee cells) to ensure all regions of the coffee bed are properly and evenly wetted, so that there will not be any regions of dry coffee particle groups, which tend to be hydrophobic. (This is a common occurrence if you try to stir dry oat cereals in hot water. If the oats cereals particles are not evenly wetted, it also produce regions of dry clumps) But the average of all these extraction levels may still give an average extraction yield in the ideal range (18% to 22%) given on the Coffee Brewing Control Chart.
Even the preferred/optimal range of average extraction yield (18% to 22%) has evolved, just like the preferred range of coffee strength, and is significantly impacted by factors such as degree of roasting (light roast / dark roast), grinder performance, brewing methods, high-grown / low-grown coffees, processing methods of coffee etc.
Thirdly (limitations of Coffee Brewing Control Chart), human taste is a highly non-linear perception and subjective. Oftentimes, a small change in the amount of some flavor compounds in contrast to other flavor compounds produces a huge perception of unpleasant or pleasant flavors. So the demarcation lines between under-extracted, ideal optimal balance, and over-extracted is actually not that clear as to be defined by a piece-wise discontinuous line.
To put in layman terms, lets say if the average extraction percentage of your brewed coffee is 17.7% (optimal average extraction yield is defined to be 18% to 22%), if you are the coffee taster, do you think you can perceive the cup to be under-extracted or ideal optimal cup balance? Most of us cannot differentiate the subtle difference, and might just conclude that the cup is still ideal and optimal. So in effect, the clear line demarcation should be thought of as a greyish area near the boundary lines. Conversely, if the average extraction yield is 22.2%, do you think during coffee tasting, you can taste the difference between over-extracted cup or ideal optimal cup balance? Personally, I might just conclude the cup is still ideal and optimal balance.
So the moral of the story is, even if you own and use a TDS meter to guide you in your coffee brewing, always taste your coffee to see your brewing results, as that is the final qualitative product you are giving to the consumer on the quality of coffee brewed, not your scientific data :).
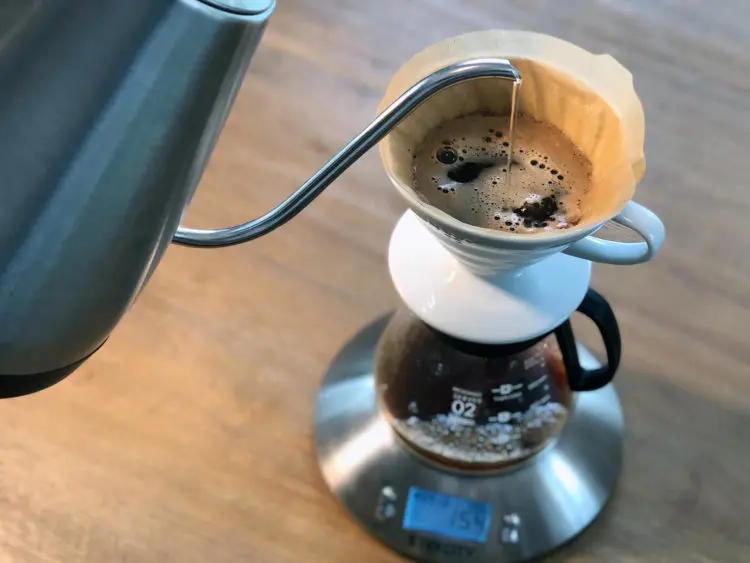
And for pour-over coffees, always try to ensure even extraction by your control of the goose-neck kettle water flow, pour in concentric circles slowly to wet all parts of the coffee bed evenly and make sure the coffee bed distribution is evenly flat before you start to pour your hot water stream. Even extraction is desired to get an evenly extracted cup of coffee. You realize baristas can more easily debug/resolve their brew parameters or factors, once they achieve as close to even extraction as possible, using the Coffee Brewing Control Chart as a tool.
I want to focus on learning how baristas or coffee-enthusiast can apply/use the Coffee Brewing Control chart as a useful tool to calibrate the taste of their coffee brew recipe, and coffee brewing methods of their choice.
1.2 AVERAGE EXTRACTION YIELD

To be able to confidently apply the Coffee brewing Control Chart in brewing coffee, let us dive more deeply into the concepts of average extraction yield, In this blog, I am going to skip discussing coffee strength or TDS, as extraction yield directly impacts/correlates with the taste profile of the brewed coffee (if coffee is a musical instrument, extraction yield is analogous to the timbre quality and tone of the instrument, and coffee strength is analogous to the how loud the music from the instrument is.)
Most of us have heard the jargon that coffee is 98% water, which is quite true for most brewed coffees with 1% to 2% dissolved coffee solids, with the exception of espresso coffee which is more concentrated with coffee soluble compounds, and insoluble compounds like insoluble coffee solids and coffee oils. In this blog, let’s discuss these 1% to 2% total dissolved coffee solids in terms of average extraction yield/percentage.
A large fraction/proportion of coffee beans are non-soluble in water eg cellulose walls (polysaccharides) of the coffee cells. Some coffee compounds (like coffee oils/lipids) are non-soluble in hot water, but under certain conditions, it can still be extracted by hot water to form colloids/emulsions (like the thick crema on top of your espresso coffee). Because of this, only about 30% of typical coffee beans (by weight) can really be extracted with standard brew methods, and this put an upper limit on the maximum/highest average extraction yields we might encounter (even for espresso percolation).
I am not going to dive deeply into the actual knowledge of the coffee compounds as it will confuse my readers (i.e. caffeine molecules, chlorogenic acids, various coffee organic acids, various coffee sugars, coffee oils/lipids, various alkaloids like trigonelline and melanoidins etc.) to understand extraction, but just sufficiently knowledgeable that coffee contains a large amount of distinct coffee compounds, that together get extracted in the hot water into the cup to build an overall coffee experience of flavor.
Some of these coffee flavor compounds (coffee acids, coffee sugars etc) are very soluble and get extracted very quickly into your brew. Some of other coffee flavor compounds are less soluble and get extracted more slowly. Normally, coffee organic acids is the most soluble of all, followed by coffee sugars, followed by caffeine, and other bitter coffee compounds.

1.3 OVER-EXTRACTED COFFEE (Extraction Yield above 22%)
If one should extract the coffee cells to the extreme (like you put your ground coffee in a French Press in hot water for more than 20 min, eg an hour or even a day:)), that the cup of coffee include every dissolvable coffee compounds the coffee beans contain (i.e. average extraction yield of 30% to 32%), then these slower-extracting compounds will all get into your cup of coffee.
Typically, most of these slower-extracting coffee compounds taste very bitter, harsh, and very astringent (just like the drying puckering sensation on your tongue when you eat unripe bananas, drink over-brewed teas, or the skin of the grape.) Astringent coffee compounds include CGA chlorogenic acid and tannins, both of which belong to a chemical group known as polyphenols, which are large organic molecules and less soluble in water compared to other coffee acids and sugars. This is the perceived taste of over-extracted coffee to the extreme.
Most people may assume that coffee that is too strong is also over-extracted / overdeveloped. This is a misconception; as the Coffee Brewing Control Chart shows coffee can be strong yet still under-extracted (Region no.4). (Try tasting the pour-over coffee in the first 20 second of the blooming stage, and you know why 🙂)

1.4 UNDER-EXTRACTED COFFEE (Extraction yield under 18%)
On the flip side of the extraction coin, a coffee with an average extraction yield of less than 18%
(Extreme case: try timing 20 seconds of your pour-over coffee dripping during the bloom phase, and taste your coffee 🙂 or your French Press coffee you do not allow at least 4 min to 6 min of steeping/immersion time i.e. you time 1 min and go taste the brew 🙂)
would exclude lots of interesting compounds, and the coffee sugars and the interesting fruity/floral notes compounds are not sufficiently extracted, resulting in lots of coffee acids overpowering your brewed coffee. Hence, under-extracted coffee usually taste sour, highly acidic (yes even though in coffee-tasting jargon, we state that coffee acidity does not exactly mean the pH (degree of acidity or alkalinity in chemistry) of the coffee, there is actually a direct correlation of the role of coffee acids in the perception of coffee acidity in tasting), lack sweetness and development of complexity/characteristics of coffee in the cup.
Most people may assume that coffee that is a weak cup is also under-extracted / underdeveloped. This is another misconception; as the Coffee Brewing Control Chart shows coffee can be weak yet still over-extracted (Region no.12). (Try brewing coffee with super low brew ratio of coffee : water, and then lengthen the extraction time in a French press, or you can use a super high brew ratio for pour-over coffee grind finer than usual to get over-extracted coffee, and then do a bypass by pouring hot water directly to dilute the coffee into a weak cup)
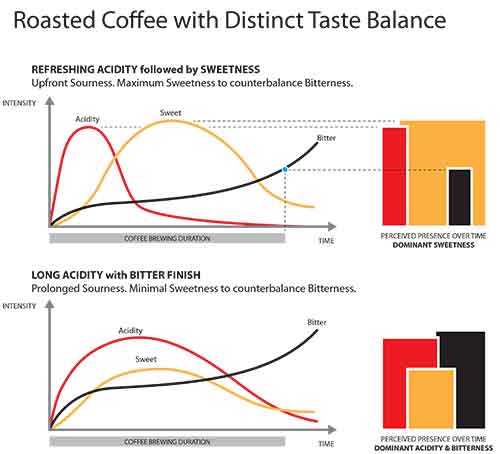
Taste preference of coffee consumers is oftentimes subjective. Brewing a good cup of coffee is part-science, part-art; it is all about achieving a good balance between coffee acids (sour), coffee sugars (sweetness), and some of the bitter/astringent coffee compounds (but not over-powering).
1.5 OPTIMAL BALANCE CUP OF COFEE (extraction yield 18%-22%)
If you do not allow sufficient brew time or steep your coffee too quickly, not enough coffee sugars will be extracted from the coffee beans (under-extracted: sour, very acidic, lack complexity of flavors) The longer the coffee brews, the more coffee sugars and aromatic coffee compounds are extracted from the grounds, making the coffee taste sweeter and pleasant, which balances out the initial acidity of the coffee. Once we reach the peak of the coffee brew time, you get a best tasting balanced cup of coffee. However, if the brewing goes too long, you will end up with more of the bitter taste in your cup (over-extracted coffee: bitter, astringent, harsh, hollow).
Hence, a barista/brewer’s responsibility is to DIAL in your chosen coffee (just like tuning in your radio frequency (eg 933) to get your radio channel quality music) so as to find the optimal brew variables settings to achieve the “SWEET SPOT” of coffee extraction via rigorous tasting. This is a science & art by itself, and also depends on your (trade area) customer’s taste profile preferences, to find the correct balance of extraction yield and strength of that coffee. In professional coffee-tasting world, the coffee professionals believe that every different coffees have its special brew variable settings aka “sweet spot” for each specialty coffee, to bring out the best aromas, acidity, body and flavor.
Assuming we can correlate good tasting coffee and give a taste value in probability values (objectively) from the balance of coffee acidity, coffee sweetness, and bitter/astringent flavors, let me set the horizontal axis (X-axis) to your brew time, and set the vertical axis (Y-axis) to your taste value, then the taste value will approximately follow a Normal/Gaussian distribution curve (bell-shaped curve) in statistics by Central Limit Theorem, if your experimental data has a large sample size, and the data is from random variables with no bias and independent.
In probability theory, Central Limit Theorem states that in many situations, when these independent random variables are summed up and if you allow a large enough sample size in the large population, then the distribution of the samples will approximately follow a normal/Gaussian distribution curve.
So as you can see, barista can find an optimal brew time for your brewed coffee, without under-extracting (in the lower 68 percentile region), or over-extracting (in the upper 68 percentile region). Not going into deep statistics here (I am just using the concepts of normal distribution 68/95/99.7 percentile rule), but just use it to explain stuffs for better understanding.
A great tip for baristas experimenting is, we change the grind size, brew temperature, brew ratio and brew time to try to nail a balance cup with a good extraction yield.
1.6 BREW VARIABLES: RG & 3Ts
- Brew Ratio
Using the correct proportion of coffee to water is so important that it is one of the Four Fundamentals of brewing great coffee (Proportion, Grind, Water, Freshness). A brewing recipe will always include the amount of coffee and water to be used. This information can be described in volume (a certain number of tablespoons of coffee, a certain number of ounces/milliliters of water) or in weight (coffee and water used expressed in grams), or as a brew ratio (2 numbers in relation with each other). Once you know the amount of coffee and water used, you can calculate a brew ratio expressed as 2 numbers in relation to each other. In this case, the brew ratio expresses the coffee to water ratio.
Brew ratios are important because different ratios create cups of different strengths or intensities (TDS). The higher the coffee-to-water ratio, the stronger your brewed coffee. The lower the coffee-to-water ratio, the weaker your cup. If a coffee is too strong, it might overpower/overwhelm your taste senses, and you will lose flavor nuances. If your cup is too weak, you will lose flavor itself, and your coffee becomes flat, void of character. As you can see in your Coffee Brewing Control Chart, changing your brew ratio not only affects coffee’s strength, it also affects extraction levels, and therefore the flavors in your cup. Refer to my post on the “Four Fundamentals of Brewing Great Coffee” for in-depth discussion of Brew Ratio.
https://www.youtube.com/watch?v=GmEToRR_-m4 - Grind Size
Finer coffee grinds extracts more coffee flavor components (include bitter/astringent coffee chemicals that are less soluble) than coarse grinds. Finer grinds includes more fracturing/cutting of the coffee cells, which makes hot water easier to reach the coffee chemicals as more fractured coffee cells are exposed on the fine coffee particle surface. The hot water requires less time and effort to diffuse the coffee compounds to the surface, and get easily washed out by the flow of water under gravity (in pour-over coffee). Getting the perfect grind size is part art, part science for coffees of different roast levels, and from different coffee-growing regions. - Brew Time
Longer brewing times enhances extraction. Take note that finer grinds in drip and pour-over coffee methods also lengthen the extraction/brew time, in effect doubling the extraction. Finer coffee grinds produces a higher hydraulic resistance in the coffee bed, just like how fine muddy sand provides higher hydraulic resistance to a period of rainfall, and has a tendency to slow down flow of water through it, compared to coarse sandy areas. - Water Brew Temperature
Raising brew water temperature increases extraction of coffee compounds, as solubility of coffee compounds increase with solute temperature. Higher temperature of water will increase the average kinetic energy of H20 molecules in Brownian random motion, and hence impart more energy at the diffusion process, and the washing out process of the coffee cells, thereby increasing diffusion coefficient of even the most insoluble coffee compounds.
Too hot water (water at or near boiling point 100C) can start the over-extraction process even in the initial pour/bloom. I always use water just off the boil i.e. 93C. On the other hand, if you use too cool water (i.e. 80C), it might result in under-extracted coffee, if you do not allow more brew time.
Lighter-roast coffees usually has more of the natural green coffee flavor compounds versus roasted coffee compounds created in the Milliard Reaction and to some extent Strecker Degradation. In general, light-roast coffees have more coffee acids, more coffee sugars (that are not degraded via Milliard Reaction), and less of the roasted flavor compounds (like melanoidins, bitter ashy flavors)
In contrast, Dark-roast coffees has more roasted flavor compounds than natural coffee flavor compounds (some of the coffee acids and sugars are degraded via Milliard Reaction during roasting). Due to this, baristas can use a higher brew water temperature (e.g. 95C) to brew light-roast coffees without extracting plenty of bitter ashy flavors. And we can also use cooler brew temperatures of hot water (e.g. 85C) to brew dark-roast coffees, without extracting too much of the bitter ashy flavors that are abundant in the coffee beans as a result of longer roasting.
Some of the practical solutions while brewing coffee is shown in this very informative blog:
ahttps://www.homegrounds.co/why-does-coffee-taste-sour/
Let’s just say, you are a barista who own a Coffee Refractometer (if you do not have, just taste for coffee and use the tasting notes guide to see if your coffee brewed is ideal, under-extracted or over-extracted).
Choose your favorite brewing method, for me, my favorite brewing method is the Hario V60 filter. Due to different Physics of extraction (eg percolation/infusion vs immersion) behind each brewing method, understanding the Physics behind can help a barista achieve control of the brew factors/parameters through the correct thought processes, and use the Coffee Brewing Control Chart as a learning tool to guide you in achieving a balance cup of coffee.
Decide on your brew ratio recipe of your coffee, and your choice of coffee (amount of coffee to amount of water) For the convenience of this discussion, let me just use the convenient Golden Brew Ratio of 1:18 (1 part coffee : 18 parts water). Since I am calibrating my brew ratio by weights (scientifically, it is more precise), that translate to 16.7 grams of ground coffee : 300 grams of final brewed coffee, doing some simple ratio mathematics. To assist you in practical brewing, please convert your brew ratio to the exact weight of the brewed coffee (eg 300 grams) you want to achieve, as it can easily be measured on a barista scale after taring/zeroing. Some Coffee Brewing Control Chart uses Brew Ratio of gram : Liter, but it is simple to convert, making a simple assumption to simplify mathematics (just like engineers in practice do in paper calculations) that brewed coffee with characteristic TDS of 1.2% to 1.5% is 98% water, and we approximate the brewed coffee mass density is equal to that of pure water, which is 1 gram/ml. The Golden Brew Ratio will translate to 55.6 grams of coffee : 1 Liter of brewed coffee.
From the diagonal linear lines of the chart, find the line that corresponds to your chosen coffee brew ratio. The Golden Brew Ratio (1:18) corresponds to the most centered diagonal line that cuts through the Coffee Brewing Control Chart 3 main taste profile regions i.e. strong & over-extracted, ideal optimal balance cup, and weak & under-extracted. Please refer to the 2nd Coffee Brewing Control Chart in my blog. Hence, the barista has a clear mind-map of the possible taste profiles of their favorite brewing method and chosen brew ratio, and start to use taste to judge their cup of coffee. (if let’s say you do NOT have a Coffee Refractometer).
Next, decide on your grind size settings (medium fine), brew water temperature (93C), and how you want to pour your water in how many pour steps in your blooming, and extraction phase (3 pours). I will not go deep into the pour techniques in this blog, as if I have the time, I will blog this learning in another article/blog.
Then you start to brew your coffee with your desired Brew Ratio (1:18) (16.7 grams ground coffee / 300 grams of brewed coffee) with your favorite brew method (V60 filter).
Take a sample of brewed coffee in a small cup, and allow that small sample to sufficiently cool down. Then use a dropper to suck up the cooled brewed coffee, and place a few drops of coffee onto the sensor part of your coffee TDS meter. Once the coffee TDS meter gives you a reading of the coffee TDS, which determines the concentration of coffee soluble in your cup, find a horizontal line that corresponds to that TDS reading.
Find where the horizontal line TDS reading intersects with your diagonal line that corresponds to your brew ratio (1:18). At the point where they intersect, draw a vertical line all the way down the Coffee Brewing Control Chart to get the reading of the average extraction yield.
For example, in the Golden Brew Ratio (1:18) using V60 filter, if you find that your brewed coffee is too strong to your liking (Region 6: over-extracted coffee), you may be using too fine grind size, or too hot brew water temperature. Grind a few clicks coarser (remember grind settings have a double effect as it also affects your brew time), or use a slightly cooler brew temperature, or you can even use the bypass method to dilute your coffee to your desired coffee strength, by adding pure hot water directly into your brew instead of the coffee bed. Adjust one brew parameter at a time to tweak your brew, and taste again.
If your brewed coffee is ideal and balanced cup (Region 8), it is good news for you, you have find your ideal coffee recipe for the coffee you choose (eg Starbucks Veranda Blend). Enjoy!
If your brewed coffee is too weak to your liking (Region 10: under-extracted coffee), you may be using too coarse grind size, or too cool brew water temperature. Grind a few clicks finer (remember grind settings have a double effect as it also affects your brew time), or use a slightly hotter brew temperature.
https://www.homegrounds.co/coffee-compass/
Barista Hustle devise a systematic way of dialing in your manual brews using a taste compass known as the Coffee Compass. The brewer can use it to fix your brew, even if one has no intuitive knowledge of coffee extraction theory.
